

Deficits, Inflation, and the End of 60/40
By Jackson Hurley • Fourth Wall Advisors
Introduction
For a generation of investors, the 60/40 portfolio—60% stocks, 40% bonds—represented the pinnacle of prudent asset allocation. This simple formula delivered consistent returns with manageable risk, backstopped by a fundamental assumption: when stocks fell, bonds would rise, providing a natural hedge. That assumption died in 2022, and with it, the easy certainties of portfolio construction that dominated investing for over two decades.
When stocks and bonds move in the same direction, the diversification benefit that made 60/40 portfolios so resilient evaporates. Investors who believed they were protected from equity volatility through their bond holdings discovered in 2022 that both assets could plummet simultaneously, delivering the worst year for a balanced portfolio in modern history.
The comfortable negative correlation between stocks and bonds that prevailed from the late 1990s through 2020 reversed in mid-2021, driven by a toxic combination of persistent inflation concerns, ballooning fiscal deficits, and higher interest rates.
A Quarter Century of Fiscal Deterioration
To understand how we arrived at this precarious moment, we must trace the path of American fiscal policy through five major legislative episodes that transformed the United States from a nation running budget surpluses to one facing structural deficits that threaten economic stability.
The 1990s: When Bond Vigilantes Ruled (1993-2001)
The story begins not with fiscal excess, but with fiscal discipline enforced by market pressure. When Bill Clinton took office in 1993, he inherited substantial budget deficits and ambitious plans for expanded social programs, including universal healthcare. The bond market's response was swift and brutal. So-called “bond vigilantes,” concerned that runaway deficits would revive the recent inflation of the 70s and 80s, sold off US duration until Clinton surrendered. From October 15, 1993 to November 7, 1994, the 10-year yield climbed from 5.19% to 8.05%. This period, informally known as the "Great Bond Massacre," sent a clear message that fiscal profligacy would not be tolerated.
Clinton political adviser James Carville famously captured the moment: "I used to think that if there was reincarnation, I wanted to come back as the president or the pope or as a .400 baseball hitter. But now I would like to come back as the bond market. You can intimidate everybody."
In response, the Clinton administration abandoned its spending plans and pursued aggressive deficit reduction. By 1998, the federal government was running surpluses, and the 10-year yield had dropped to 4.16%. Largely because the Clinton administration responded to bond market pressure by balancing the budget, and the Fed retained its credibility, inflation did not return.
The Long Stagnation (2000-2020)
When budget deficits returned in the 2000s and 2010s, inflation was the dog that did not bark. As the long bull market in bonds that started in the 1980s continued and memories of the 1970s faded, the narrative behind bond vigilantism gave way to a new paradigm.
From 2000 until 2020, the US economy faced two recessions followed by slow recoveries. Interest rates were cut and quantitative easing put in place to spur investment. When the Fed hiked, it was not in response to inflation, which seemed stuck at or slightly below 2% no matter what the Fed did, and no matter how wide the federal deficit got, but in order to stay above zero so that the Fed would have room to cut again in the future.
The Bush Tax Cuts: The Beginning of the End (2001-2003)
In 2001, the Congressional Budget Office projected surpluses as far as the eye could see. The dot-com bubble had burst, creating recession fears, and the September 11 attacks added economic uncertainty. President George W. Bush's response, the Economic Growth and Tax Relief Reconciliation Act of 2001 (EGTRRA), seemed reasonable at the time. The 2001 and 2003 tax cuts reduced the top four marginal income tax rates, with promises that economic growth would compensate for lost revenue. Instead, the cuts would add $5.6 trillion to deficits from 2001 to 2018.
In stark contrast with the massacre of 1994, bond markets absorbed the increased issuance without drama. The negative stock-bond correlation, which began in 1998, remained intact, and even strengthened, as growth concerns dominated inflation worries. Policymakers began to learn the lesson that deficits didn't matter.
The Financial Crisis and ARRA: When Deficits Were Necessary (2009)
The 2008 financial crisis reinforced this dynamic on a much larger scale. Facing economic collapse, even fiscal conservatives acknowledged the need for massive stimulus. The American Recovery and Reinvestment Act of 2009 represented Keynesian economics on steroids: The approximate cost of the economic stimulus package was estimated to be $787 billion at the time of passage, later revised to $831 billion between 2009 and 2019.
Unlike the Bush tax cuts, ARRA had immediate and measurable effects. Because of the fiscal stimulus, real GDP was about $460 billion (more than 6 percent) higher by 2010, there were 2.7 million more jobs; and the unemployment rate was almost 1.5 percentage points lower. Crucially, markets didn't punish this fiscal expansion. Instead, fears of deflation dominated and treasury yields fell even as issuance soared. The negative stock-bond correlation held firm even in crisis.
The Obama administration faced significant political constraints in pushing through stimulus. His economic advisors, including Larry Summers, worried about causing inflation and debt crisis. The Tea Party emerged in 2010 as a reaction against perceived fiscal profligacy, and the Romney-Ryan ticket in 2012 ran on a platform of slashing spending maintaining rigorous fiscal discipline.
The Tax Cuts and Jobs Act: Fiscal Stimulus at Full Employment (2017)
Donald Trump’s takeover of the Republican party in 2016 came at the direct expense of the fiscally conservative core of the Republican establishment. If ARRA represented necessary fiscal expansion during crisis, the 2017 Tax Cuts and Jobs Act (TCJA) represented its opposite: unnecessary stimulus when the economy was already at full employment.
Passed through reconciliation with only Republican votes, TCJA slashed corporate tax rates from 35% to 21% and reduced individual rates across the board. Coming at a time when unemployment was already low and growth solid, the tax cuts provided a sugar high to markets while adding roughly $1.5 trillion to deficits over a decade. In order to lower the headline number from scorekeepers when it was passed, it was written so that most of its provisions are set to expire in 2025.
The market response was muted. The 10-year Treasury yield rose gradually from 2.4% when TCJA passed to 3.2% by late 2018 before falling back to 2.1% in 2019.
The Pandemic Response: Too Big (2020-2021)
After a decade of slow recovery from the GFC, a consensus emerged, especially among Democrats, that the $800 billion stimulus was too small, and the economy would have recovered faster if only Congress had gone bigger in 2009.
In early 2020, the economy largely shut down and 20 million people lost their jobs within a month. If the 2008 crisis response was large, the pandemic response was gargantuan. Between the CARES Act, additional stimulus measures, and expansive Federal Reserve policies, the total fiscal and monetary response exceeded $5 trillion. Initially, both stocks and bonds rallied as liquidity flooded the system, household balance sheets were replenished, and demand remained strong.
But something fundamental had shifted. In 2020, the inflation rate was stable around 2%, but by mid-2021, inflation had spiked. Markets were slow to respond, and policymakers even slower. Inflation breakevens lagged realized inflation throughout 2021. Economists inside and outside the Biden administration insisted that inflation was “transitory”.
By March 2021, when the Biden administration passed the American Rescue Plan, a $1.9 trillion stimulus on top of the already generous relief passed during 2020, the economy was running hot and inflation was already accelerating. By November 2021, with inflation at 7%, Biden followed up with the Infrastructure Investment and Jobs Act, adding $500-700 billion in spending. Then in August 2022, Democrats passed the Inflation Reduction Act (IRA) and CHIPS and Science Act. Though the IRA included tax provisions that would ultimately make it deficit-neutral, it was structured to frontload spending on environmental tax credits, such that on net, it added approx $50 billion to the deficit each year from 2023 to 2028. The CHIPS Act authorized $280 billion in spending over 10 years, though Congress is unlikely to appropriate the full amount for the science funding, and the bill is on track for closer to $100 billion.
Liberation Day: Return of the Bond Vigilantes
Like Clinton before him, Trump now faces the prospect of bond vigilantes becoming a check on his policy agenda. In the 1990s, Clinton was forced to abandon spending plans and embrace fiscal discipline after bond yields soared. In April, Trump reversed many of his Liberation Day tariffs, citing a sudden jump in bond yields: “They were getting yippy.” For perhaps the first time in the modern era, bond vigilantes forced an immediate policy reversal.
The “Big Beautiful Bill” (2025)
This history brings us to the present moment and Trump's "One Big Beautiful Bill" (BBB). The measure would add more than $2.5 trillion to the federal debt over the next ten years, coming at a time when annual deficits will grow from 6.2 percent of GDP in 2025 – already twice as high as they were as recently as 2016 – to 7.3 percent of GDP by 2055.
The bill's passage through the House came after intense negotiations. The vote was 215-214, with one Republican voting present. The legislation permanently extends the 2017 tax cuts while adding new provisions: the bill extends and increases the Child Tax Credit from $2,000 to $2500, eliminates income taxes on overtime, tips and social security payments, and increases the SALT deduction.
So far, the bond market has been modestly responsive, but hardly vigilantist. During the peak of BBB negotiations and budget uncertainty, 10y yields barely moved, and 10y inflation breakevens are flat at around 2.3% since the beginning of the year, barely above target rate.
Budget Overview
Deficits create liabilities in the balance sheets of governments and corresponding assets for bondholders. Of the ~$29 Trillion in government debt held by the public, approximately a third is held by foreign investors and governments, with the rest held by US households and the private sector. One way of looking at the last twenty years of deficits is as a massive transfer of wealth from the government’s balance sheet to household balance sheets, which are doing historically well as a multiple of GDP.
The distortions created by this imbalance and its potential unwinding will shape the coming market regime, but for now it is only widening. The deficit remains elevated at around 6% of GDP. As we will see, this is driven primarily by the high costs of entitlement programs as baby boomers retire.
Revenues
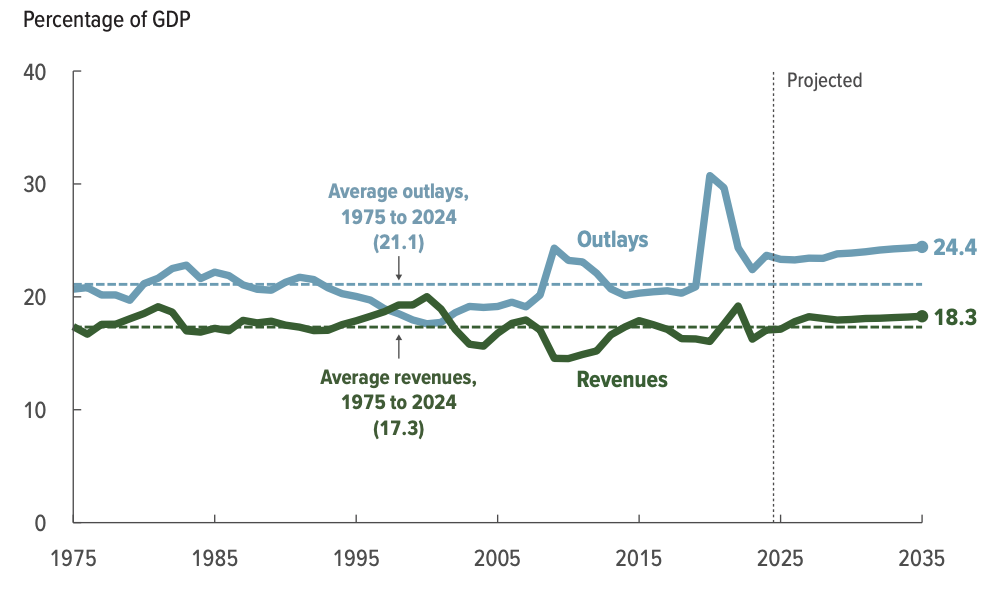
The overall structure and level of tax revenues have not changed radically in the last 50 years. Most of the variation in receipts/GDP since 1970 comes from the cyclical effect of economic recessions on revenues, rather than large changes in tax policy.
The Big Beautiful Bill is set to increase the deficits by approximately $2.5 trillion. Yet, the bill is less a cut than a continuation of past cuts artificially set to expire in 2025-6. If passed, BBB will keep income tax revenue near its long-term average of 8-9% of GDP, rather than allowing it to increase to an unprecedented 10% of GDP, as the CBO estimates will otherwise occur.

Spending
The trouble with keeping tax revenues stable is that federal expenditures and interest payments are set to mechanically increase as a proportion of GDP. As the population ages and baby boomers retire. Social Security and Medicare, which are adjusted for inflation and tied to the growing number of retirement-age Americans, are growing at over 7% per year.

Discretionary spending has been falling as a proportion of GDP since the GFC. Further cuts are projected, but these will not be sufficient to outweigh even the growth of mandatory spending and interest costs.
The political outlook for fiscal hawks is grim. Early hopes that DOGE might reduce federal spending have been crushed, as federal spending continued to rise even at its disruptive peak in February and March, and now as Elon Musk has stepped away to run his companies and feud with Trump. DOGE aimed mostly at discretionary, which, as seen below, was never a realistic source of savings on the promised scale to begin with.
Financial Repression: Lessons from 1945-1980
In the post-World War II era, the Federal Government had accumulated debt of 120% of GDP. In just ten years, that number was reduced to 70%, and by 1980, debt levels reached a low of just over 30% of GDP. The government maintained a mostly balanced budget during this period, and the country enjoyed favorable demographics and robust economic growth until the 1970s.
However, the primary mechanism by which the debt was reduced between 1945 and 1960 was financial repression – market and non-market interventions to keep real interest rates on government debt artificially low (-5% to -10%). The government let inflation run hot to erode the real value of its debt.
There are several parallels today with the 1940s-50s. Debt to GDP was over 100% of GDP. Like today inflation came after a period of persistently low aggregate demand. A generation of leaders had just lived through the Great Depression and learned the lesson that the risk of doing too little is often worse than doing too much.
One major difference between today’s situation and that of the 1940s is that our leaders lack the tools and the political capital of a wartime government to impose major costs on asset-holders. In the 1940s, most of the debt was accumulated during the war through bond drives that appealed to buyers’ patriotism. The wartime congress had enacted a comprehensive plan of price controls without serious pushback, so the financial repression of the post-war period required mostly the continuation of pre-existing policies and authorities.
From 1933 until 1980, Regulation Q established caps on the interest banks could pay depositors. The Bretton Woods system established the US Dollar as the reserve currency, fixed exchange rates, and involved extensive capital controls (in the US from 1960-1974), ensuring that the capital needed to roll over debt at low real interest rates had nowhere else to go.
While the underlying economic conditions may make financial repression attractive in the coming years, we have little confidence that today’s leaders would succeed at implementing the kind of comprehensive regulatory system necessary to pull it off. Capital controls, which have not been used since 1974, are no longer in the political toolkit. Ideological commitment to the free flow of capital is widespread, especially among Republicans, and the financial sector, which would vigorously oppose comprehensive regulation, is larger and more powerful than it was in the mid-20th century.
Given the current administration’s responsiveness to market pain, its implementation of financial repression would likely be half-hearted, much as its back-and-forth tariff policy has been. Moreover, elements of the Trump administration have stated a preference for a lower dollar, so it may be slow to respond to capital flight should it begin.
The most plausible scenario is that the next Fed chair after Powell steps down in 2026, who may be more loyal to Trump, will face pressure to keep rates low even as inflation runs above target. Executive action could be taken via the IEEPA to prevent capital flight by foreigners, but that would only disincentivize capital from entering the United States to fund the deficit. The result would be capital outflows and dollar depreciation.
Lessons From Emerging Markets
Emerging markets (EMs) offer valuable insights into the dangers of persistent fiscal deficits and inflationary pressures. Historically, EMs have frequently experienced rapid debt escalations, currency crises, and severe inflation episodes stemming from fiscal mismanagement.
When persistent deficits occur in EMs, bond and foreign exchange markets typically react swiftly, demanding significantly higher yields to compensate for increased risks. High deficits can rapidly lead to spiraling interest payments, crowding out critical public investment and social spending. These conditions often culminate in investor loss of confidence, accelerating capital flight and sharp currency depreciation.
A notable example is Argentina, which has repeatedly experienced inflation and currency crises due to chronic deficits and fiscal indiscipline. Due to its status as the reserve currency, the U.S. has not experienced the same pressures deficits, especially during economic crises, when the dollar typically appreciates as investors rush to safety. However, one cannot simply assume that such things cannot happen in the US. The dollar experienced high inflation and extreme currency volatility between 1970 and 1990, a period during which the US had a better fiscal position and arguably faced less political and geopolitical instability than today.
As EM markets repeatedly demonstrate, unchecked deficits and casual attitudes towards inflation management can quickly erode investor trust, increase borrowing costs, and trigger currency instability.
Conclusion
The death of the 60/40 portfolio marks a fundamental shift in the economic landscape that has governed markets for over two decades. The comfortable assumptions of the post-2000 era, where deficits seemed to carry no consequences and bonds provided reliable diversification, have given way to a more volatile and uncertain environment.
The United States now faces a fiscal reckoning that has been building for twenty-five years. From the Bush tax cuts through the pandemic response, each crisis has normalized larger deficits while eroding the institutional constraints that once kept spending in check. With structural deficits approaching 7% of GDP and mandatory spending growing inexorably as baby boomers retire, the path forward offers no easy solutions.
The return of bond vigilantes, evidenced by Trump's recent policy reversals in response to market pressure, suggests that the era of consequence-free fiscal policy may be ending. Yet unlike the 1940s, when wartime unity and comprehensive financial controls enabled successful debt reduction through financial repression, today's political and economic constraints make such coordinated action unlikely.
The most probable outcome is a prolonged period of elevated inflation, volatile bond markets, and persistent tension between fiscal needs and market discipline. For investors, this means abandoning simple formulas of the past. The comfortable correlations that defined a generation of portfolio construction are gone, replaced by the harder task of navigating an economy where fiscal excess and market reality are finally converging.
In this new regime, there is no such thing as a free lunch, and the bills from decades of fiscal expansion are finally coming due.
Disclaimers:
The information contained in this email is provided for informational and educational purposes only and should not be construed as professional financial advice. Fourth Wall Advisors is not a registered investment advisor, financial planner, broker, or tax professional.
Please note the following important points:
The views expressed are solely opinions and do not constitute a recommendation to buy, sell, or hold any investment or financial product.
All investments involve risk, including the possible loss of principal. Past performance is not indicative of future results.
Any investment decisions you make should be based on your own research, goals, financial situation, risk tolerance, and consultation with qualified financial professionals.
Fourth Wall Advisors does not accept any liability for any loss or damage which may arise directly or indirectly from your reliance on the information provided.
Tax laws and regulations are complex and subject to change. Please consult with a qualified tax professional regarding your specific circumstances.
Before acting on any information provided, you should consider its appropriateness to your objectives, financial situation, and needs.
We strongly encourage you to seek advice from registered financial professionals before making any investment decisions.
BY ACTING ON THE INFORMATION PROVIDED IN THIS EMAIL, YOU ACKNOWLEDGE THAT YOU HAVE READ AND UNDERSTOOD THIS DISCLAIMER AND AGREE TO ITS TERMS.
This message does not constitute an offer, solicitation or recommendation to sell or an offer to buy any securities, investment products or investment advisory services.
This document may contain forward-looking statements that are based on our current beliefs and assumptions and on information currently available that we believe to be reasonable, however, such statements necessarily involve risks, uncertainties and assumptions, and investors may not put undue reliance on any of these statements. The information generated by the charts, tables, and graphs presented herein is for general informational and general comparative purposes only.
References to indices or benchmarks herein are for informational and general comparative purposes only. Indexes are unmanaged and have no fees or expenses. An investment cannot be made directly in an index.
The information in this presentation is not intended to provide, and should not be relied upon for, accounting, legal, or tax advice or investment recommendations. Each recipient should consult its own tax, legal, accounting, financial, or other advisors about the issues discussed herein.